

Imagine an AI coding agent generates a set of microservices for a new business workflow.
The code compiles. Unit tests pass. The containers start. Health checks turn green. The APIs return the expected responses. Logs appear in the platform dashboard.
By the normal definition of software delivery, the system looks ready.
Then a downstream dependency becomes slow.
The service begins retrying. Latency increases. A queue backs up. One workflow times out after another service has already changed business state.
The logs still exist.
They show request paths, status codes, timestamps, and generic errors.
But they do not identify which dependency slowed down, why a fallback was not selected, which state transition completed, which transaction must be compensated, or whether the final retry created a duplicate action.
The system functioned correctly under expected conditions.
Under failure, it became unknowable.
Was it production-ready?
I would argue that it was never fully correct.
The Gap Between Runnability and Operability
Software quality has often been evaluated through functional behavior:
Does the code compile?
Do the tests pass?
Does the API return the expected result?
Does the system meet its latency target under normal load?
Those questions remain necessary.
They are no longer sufficient.
Production systems fail through combinations that are difficult to capture in functional tests: dependency degradation, timeouts, stale state, retry storms, network corruption, clock skew, partial transactions, policy conflicts, model drift, tool errors, and human-approval delays.
When these conditions occur, an operable system must emit enough evidence for people and automated reliability agents to reconstruct what happened.
That is the difference between runnability and operability.
A runnable system can execute its expected path.
An operable system can expose its behavior when reality does not follow that path.
What the July 2026 Study Found
A July 2026 preprint titled Can Large Language Models Generate Observability-Aware Code? examined whether coding agents generate systems that are not only runnable but observable during failure.
The study evaluated observability at two levels.
At the source level, the researchers removed human-written observability artifacts from 10 open-source and eight industrial repositories. Across 1,223 instances, coding agents were asked to restore those artifacts.
The agents were better at determining where instrumentation should be placed than what diagnostic semantics it should capture.
At runtime, the researchers generated 200 microservice systems from architecture specifications, deployed them on Kubernetes, and injected 13 representative production fault types using Chaos Mesh.
This produced 1,615 executable failure instances.
The faults included:
Pod termination
Network delay
Upstream service failure and slowness
Database outage and latency
Cache outage and latency
Queue outage and latency
CPU stress
Network corruption
Time skew
The researchers measured Fault Signal Rate: the percentage of injected failures that produced explicit, fault-specific evidence in logs.
Across the evaluated models, the baseline Fault Signal Rate ranged from 4.95% to 13.99%.
The generated services frequently emitted logs. But most of those logs did not identify the underlying failure condition.
Faults with obvious error manifestations were easier to expose. Upstream failures, pod crashes, and cache outages were more visible because they naturally produced connection failures or error responses.
Implicit failures were substantially harder.
Time skew, CPU stress, and network corruption produced very low signal rates because useful diagnosis required the system to proactively capture additional runtime context.
The researchers then added lightweight observability-oriented guidance derived from real-world commits. The guidance improved some results, but the best Fault Signal Rate remained only 16.53%.
This result should be interpreted carefully.
It is a controlled preprint benchmark, not a universal prediction of production performance. It focuses primarily on logs and evaluates specific generated microservice systems and fault types.
Enterprises should validate the findings against their own languages, frameworks, telemetry stacks, architectures, and failure modes.
The architectural lesson is still compelling:
The presence of instrumentation does not guarantee diagnostic usefulness.
Logs Without Meaning Are Operational Noise
Teams often measure observability through telemetry volume:
Number of log events
Number of spans
Metric coverage
Dashboard count
Percentage of services with an instrumentation agent installed
These numbers describe instrumentation coverage.
They do not prove that the system can explain a failure.
Suppose a service records:
Request completed with status 201.
That statement may be accurate.
But during a time-skew fault, it does not tell the operator:
Whether the event timestamp was trusted
Whether the request violated ordering assumptions
Whether the persisted record used a different clock source
Whether a downstream system rejected the result
Whether a retry created a duplicate
Whether the business state now requires compensation
The log contains data but not diagnostic semantics.
Useful observability connects a signal to the runtime condition that produced it.
It captures the affected dependency, state, identity, decision, failure mode, and outcome needed to distinguish one failure from another.
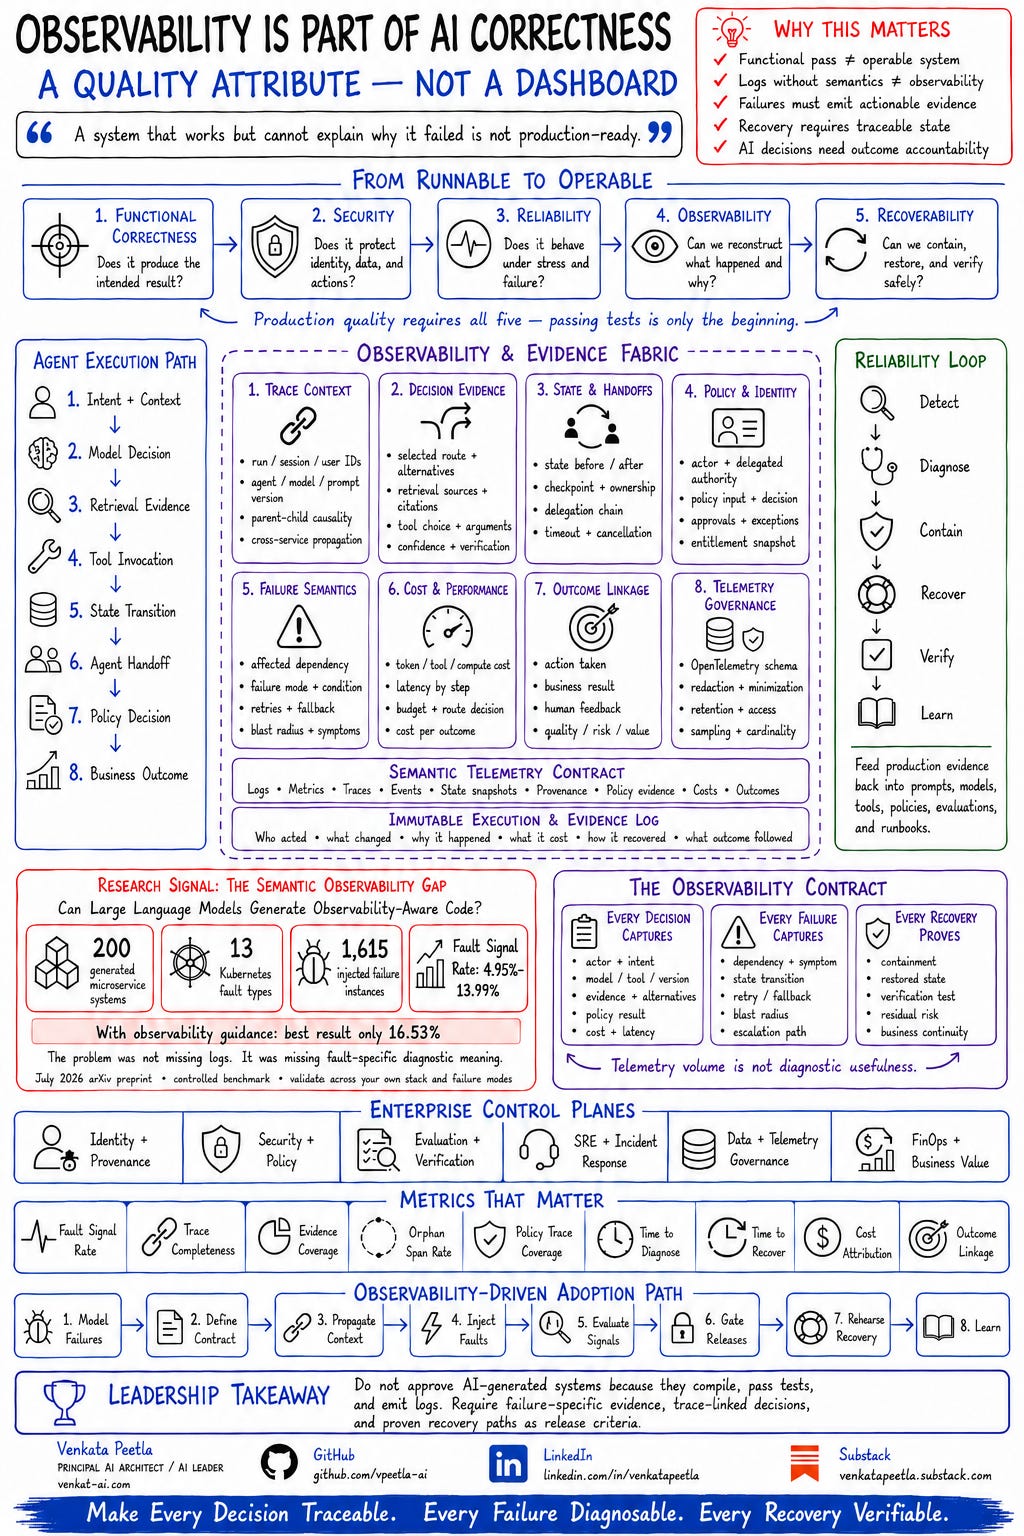
AI Correctness Requires Five Quality Gates
For AI-generated and agentic systems, I recommend treating production correctness as a set of independent but connected quality gates.
1. Functional Correctness
Does the system produce the intended result under defined conditions?
This includes conventional tests as well as model and agent evaluations:
Task success
Groundedness
Tool selection
Parameter correctness
Workflow completion
Business-rule conformance
2. Security
Does the system protect identities, data, tools, and transactions?
This includes:
Agent and workload identity
Delegated authority
Least privilege
Prompt and tool security
Data minimization
Policy enforcement
Human approvals
Secrets management
Auditability
3. Reliability
Does the system behave predictably under stress, degradation, and partial failure?
This includes:
Timeouts
Retry budgets
Circuit breakers
Fallback routes
Idempotency
Checkpointing
Capacity controls
Dependency-failure handling
Service-level objectives
4. Observability
Can operators reconstruct what happened and why using emitted evidence?
This requires more than a successful trace export.
The trace must carry the semantics needed to understand model choices, context, tool calls, state transitions, agent handoffs, policy decisions, failures, and outcomes.
5. Recoverability
Can the organization contain the impact, restore intended state, and verify that recovery succeeded?
This includes:
Rollback
Compensation
Replay
Checkpoint restoration
Queue repair
Credential revocation
Agent containment
Human escalation
Post-recovery verification
Passing one gate should not compensate for failing another.
A functionally accurate agent with weak policy controls is unsafe.
A secure system that cannot recover is fragile.
A reliable system whose failures cannot be reconstructed remains operationally risky.
The Semantic Observability Fabric for Enterprise Agents
Agent platforms create a richer execution path than a conventional request-response service.
A single business interaction may include:
User intent and session context
Model and route selection
Retrieval from several knowledge sources
One or more tool calls
State transitions and checkpoints
Handoffs between agents
Policy decisions and approvals
Costs, actions, and business outcomes
An enterprise observability fabric must connect these steps into one causal execution record.
Trace Context
Every execution should carry stable correlation across the user request, agent run, model calls, retrieval, tools, services, workflows, and business transactions.
At minimum, the system needs identifiers for:
Run
Session
User or initiating service
Agent
Model
Prompt
Workflow version
Parent-child execution relationship
Without context propagation, an enterprise receives isolated spans rather than an execution narrative.
Decision Evidence
For consequential decisions, capture what was selected and the evidence available at that point.
This may include:
Selected model, agent, or tool
Routing constraints and alternatives
Retrieved sources and citations
Tool arguments and validation results
Confidence and verification status
Evaluation or policy thresholds
The objective is not to store hidden model reasoning.
It is to preserve observable decision evidence that supports governance, diagnosis, and replay.
State and Handoffs
Agent systems are stateful even when the underlying model call is stateless.
Capture:
State before and after an action
Checkpoint and workflow version
Current owner
Delegation chain
Timeout and cancellation reason
Retry and compensation status
This becomes essential when a workflow pauses for approval, transfers to another agent, or recovers after a crash.
Policy and Identity
Every consequential action should be attributable to an actor and an authority.
The evidence should preserve:
End user or initiating service
Acting agent or workload identity
Delegated authority
Entitlement snapshot
Policy input and decision
Approval, denial, or exception
Policy and rule version
Without this evidence, an operator may know what tool was called but not why the system believed the call was authorized.
Failure Semantics
This is the area highlighted most clearly by the study.
A useful failure event should identify:
The affected dependency
Observed condition
Expected condition
Failure mode
Retry and fallback behavior
Relevant state
Blast radius
Escalation path
“Tool call failed” is not enough.
A diagnostically useful signal would say:
Inventory API exceeded the 800 ms deadline after two retries. The fallback cache was stale beyond the policy threshold. The order recommendation stopped before commit.
That provides enough context to understand the failure, confirm the state, and determine the appropriate recovery action.
Cost and Performance
Agent observability should connect latency and cost to individual execution steps.
Capture:
Model tokens
Retrieval operations
Tool usage
Compute or sandbox consumption
Retries
Route changes
Human-review effort
The goal is to move from total AI spend to cost per successful and governed business outcome.
Outcome Linkage
The trace should not stop when the model returns an answer.
It should connect to:
Action taken
Business state changed
User acceptance or rejection
Quality and risk result
Downstream success or failure
Measurable business value
This closes the loop between system behavior and enterprise impact.
OpenTelemetry Is the Carrier, Not the Proof
OpenTelemetry is increasingly important for vendor-neutral AI observability.
Its semantic conventions provide shared names and structures for telemetry across applications, infrastructure, models, and tools.
The Generative AI attribute registry includes concepts such as:
Model operations
Workflow names
Tool definitions
Tool types
Token usage
Model request and response metadata
That common language matters.
It reduces platform fragmentation and allows telemetry to move across collectors and analysis backends.
But adopting OpenTelemetry does not automatically make a system observable.
OpenTelemetry can carry a span.
It cannot determine whether that span includes the dependency state, policy result, business context, or failure semantics needed for diagnosis.
Enterprises therefore need a semantic telemetry contract layered on top of standard conventions.
The contract should define:
Required attributes by operation and risk tier
Cross-service and cross-agent context propagation
Versioning and compatibility rules
Failure-specific events
Policy and identity evidence
State-transition evidence
Cost and outcome linkage
Redaction and data-minimization policy
Sampling and retention requirements
CI/CD validation rules
Treat telemetry schemas like public APIs.
Version them, test them, and prevent teams or generated code from silently breaking them.
Observability Must Be Tested Under Failure
Code review can confirm that instrumentation exists.
Only runtime failure testing can prove that it becomes useful evidence.
An observability-driven release pipeline should include the following stages.
Failure Modeling
Identify credible failure modes across:
Infrastructure
Models
Retrieval
Tools
Identity
Policy
State
Workflows
Business transactions
Fault Injection
Inject conditions such as:
Dependency outages
Network latency
Malformed tool responses
Model errors
Retrieval gaps
Policy denials
Expired credentials
Queue disruption
State corruption
Human-approval timeout
Signal Evaluation
Verify that each failure produces the required traces, events, metrics, state evidence, and alerts.
A log or span merely existing should not count as success.
The evidence must identify the failure condition and provide enough context for investigation.
Diagnostic Testing
Ask an operator—or an independent diagnostic agent—to identify the cause using only the emitted evidence.
The team that designed the architecture should not need to explain the system during the test.
This exposes undocumented assumptions and missing operational context.
Recovery Rehearsal
Exercise:
Fallback
Containment
Rollback
Compensation
Checkpoint restoration
Credential revocation
Escalation
Verification
Confirm that recovery restored the intended technical and business state.
A healthy Kubernetes pod is not proof that a duplicated order, incomplete refund, stale entitlement, or partially executed workflow was repaired.
Release Gate
Block promotion when required failure evidence or recovery proof is missing.
This turns observability from a best practice into an enforceable quality attribute.
Metrics That Measure Diagnostic Quality
Traditional operational metrics remain useful, but the observability program also needs measures of evidence quality.
Fault Signal Rate
What percentage of injected or real failures emit explicit, failure-specific evidence?
Trace Completeness
What percentage of expected execution stages appear in the causal trace?
Evidence Coverage
Do consequential decisions include identity, context, version, policy, state, and outcome evidence?
Orphan Span Rate
How often do model, tool, or service spans lose their parent execution context?
Policy Trace Coverage
What percentage of governed actions include the policy decision and policy version?
Time to Diagnose
How long does it take to identify the likely failure condition using available evidence?
Time to Recover
How long does it take to contain the failure and restore verified business state?
Cost Attribution
What percentage of execution cost can be connected to a workflow step and business outcome?
Outcome Linkage
What percentage of production runs can be connected to a measurable business result or human feedback signal?
These metrics shift the objective from collecting more telemetry to producing better operational evidence.
The Trade-offs: Privacy, Cost, and Cardinality
Capturing more context creates real risks.
Prompts, retrieved documents, tool arguments, and model responses may contain personal, confidential, regulated, or security-sensitive information.
High-cardinality identifiers can increase storage and query costs. Full trace capture can create performance overhead and retention exposure.
A production architecture must therefore balance diagnostic usefulness with governance.
Key controls include:
Default redaction and data minimization
Allowlisted attributes instead of unrestricted payload capture
Content capture disabled by default for sensitive workflows
Tokenization or hashing of identifiers where practical
Role-based access to detailed evidence
Risk-tiered retention
Tail-based sampling for errors and consequential transactions
Cardinality budgets
Regional telemetry processing where required
Immutable audit evidence separated from operational debug data
The objective is not maximal capture.
It is the minimum governed evidence required to diagnose, audit, and recover the system.
A Practical Adoption Path
1. Model the Failures
Begin with the system’s credible failure modes—not the dashboard design.
2. Define the Semantic Contract
Specify what every decision, failure, and recovery must capture.
3. Propagate Context
Connect user, agent, model, retrieval, tool, service, workflow, and transaction activity.
4. Inject Faults
Test both explicit failures and weak-signal degradation scenarios.
5. Evaluate the Signals
Measure whether the evidence is sufficient for diagnosis—not simply whether a log or span exists.
6. Gate Releases
Require trace completeness, fault-signal coverage, and recovery evidence appropriate to the system’s risk tier.
7. Rehearse Recovery
Run game days that verify containment, compensation, restoration, and business continuity.
8. Learn
Convert production incidents and missing evidence into new tests, telemetry requirements, runbooks, policies, and evaluation cases.
Leadership Takeaway
The rapid growth of AI-generated code and agentic systems changes the observability requirement.
Teams may become responsible for increasingly large systems that they did not write line by line and may not fully understand.
The study describes this as knowledge debt: operational responsibility without equivalent authorship-based understanding.
That makes runtime evidence more important—not less.
Leaders should not ask only:
Did the agent generate working code?
They should also ask:
Did it generate the evidence required to operate, diagnose, govern, and recover that code under failure?
Observability is not a dashboard added after implementation.
It is a production-quality requirement that must be designed, generated, evaluated, and verified alongside functionality.
Do not approve AI-generated systems because they compile, pass tests, and emit logs.
Require failure-specific evidence, trace-linked decisions, and proven recovery paths as release criteria.
Make every decision traceable. Every failure diagnosable. Every recovery verifiable.
Reader Question
Which dimension is most often missing from your AI production-readiness review: observability or recoverability?
Subscribe for the next architecture deep dive: defining and enforcing a semantic telemetry contract for enterprise agents.